Gold Still Shines 50 Years After Nixon. Will Netflix?
History suggests that buying the market’s biggest stocks is a bad idea. They have nowhere to go but down.
By John Authers
Senior Editor for Markets, Bloomberg
April 15, 2020
Read the full Bloomberg Opinion article here.
Golden Years
The stock market, home of optimists everywhere, is doing very well at present. But gold, where pessimists find a home, is doing even better. In dollars, the shiny metal closed on Tuesday at its highest since 2012.
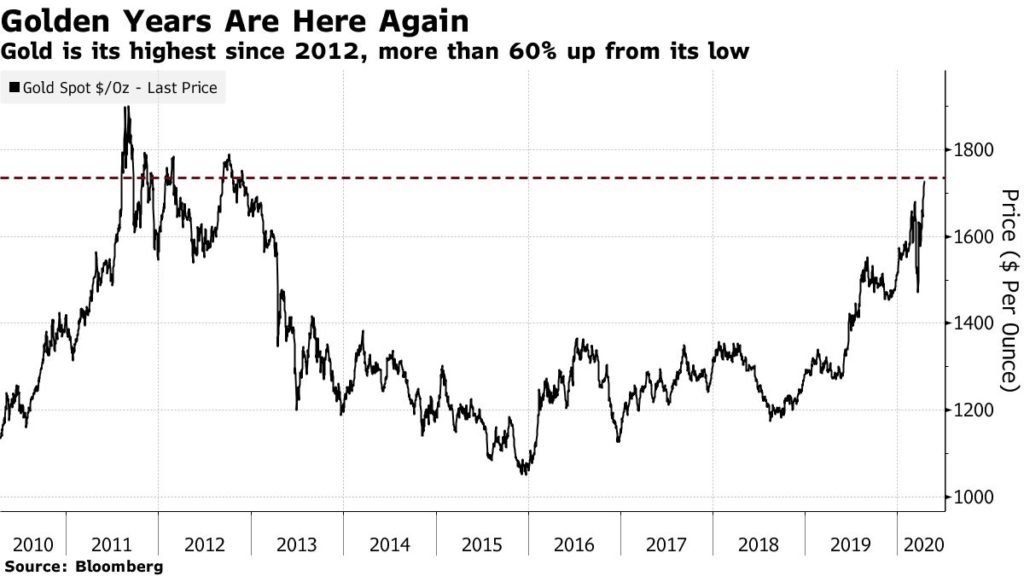
The all-time high is in sight, and it has gained more than 60% since its nadir in 2015:
At one point last month, gold was selling off amid denunciations that it had failed as a safe harbor. That was more or less entirely due to its inverse relationship with real yields on bonds. Gold’s greatest weakness as an asset is that it pays no income. Hence, when real yields go negative, gold grows much more attractive. As the bond market melted down last month, real 10-year yields briefly touched -0.6%, before gaining more than a full percentage point. They are now back around -0.6%, near an all-time low.
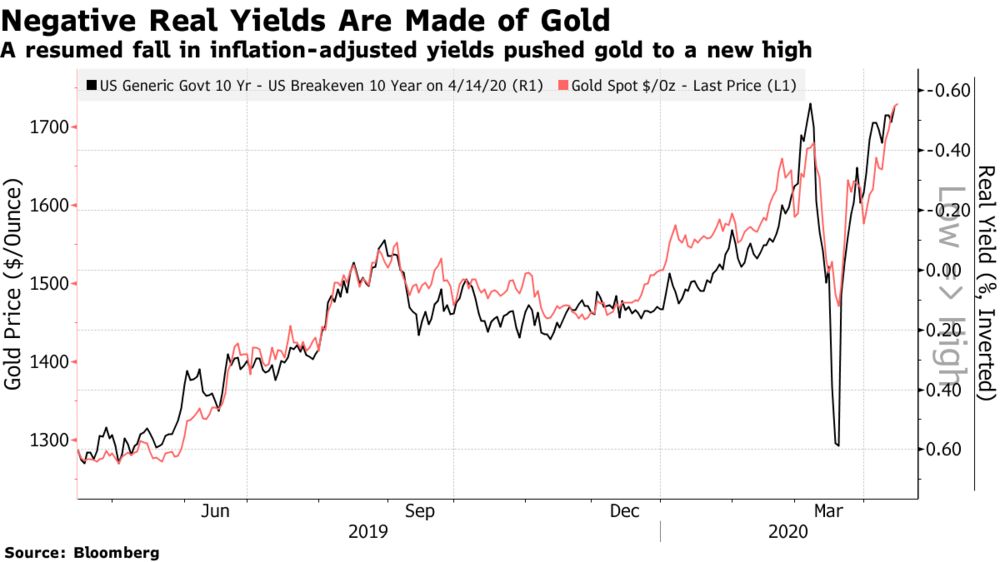
As can be seen, gold’s fall last month overlapped exactly with the brief rebound in inflation-adjusted yields:
The bond move has been driven more by a shift in inflation expectations than by the underlying yield. Inflation break-evens remain at levels lower than anything in the last 15 years bar the Lehman crisis and the Chinese devaluation of 2015.
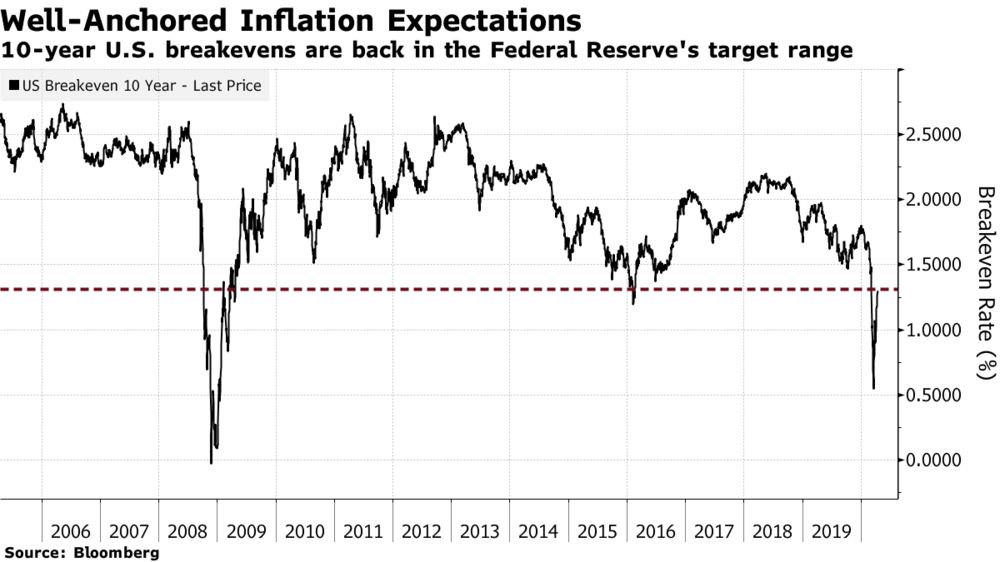
There’s no way gold’s rally can be seen as an attempt to hedge against an expected return of inflation:
Meanwhile, the fall in real yields is among many factors that have helped ease financial conditions, which has a lot to do with the stock market’s recovery. Both can be attributed in large part to the historic actions by the Federal Reserve. There is much to debate over what the Fed has done (I suspect it is a Faustian bargain), but the Bloomberg U.S. Financial Conditions index, which combines nine separate measures from different markets, shows how powerful the effect has been.
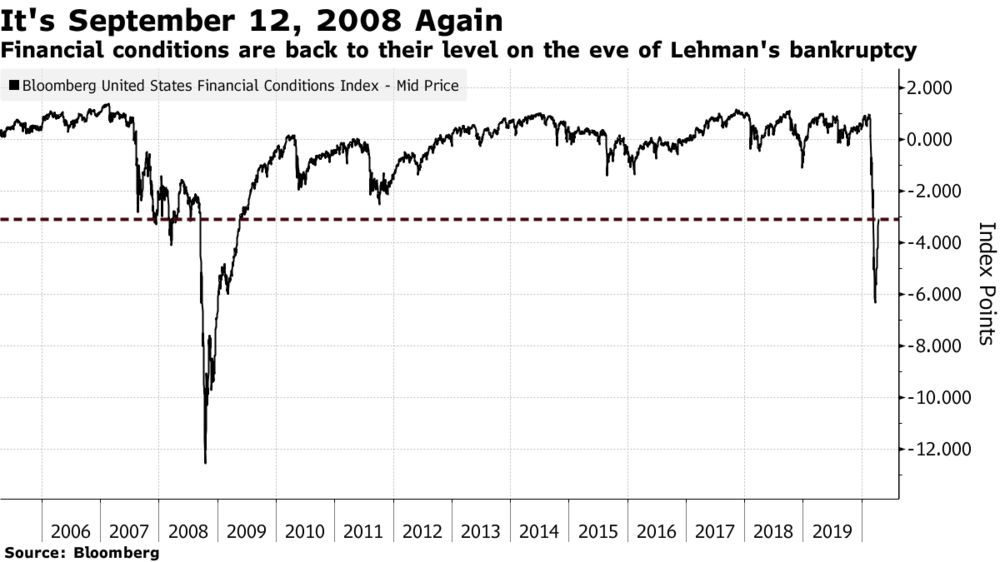
Whatever mistakes the Fed has made, it has at least corrected one error from 2008 and gone for broke straight away:
At its lowest, the financial conditions index was at its level from the week immediately after Lehman Brothers went bankrupt in September 2008. It is now back to where it was at on the Friday before Lehman went down — which is to say that we are now out of the territory where the entire financial system appeared to be broken. As the financial world had been in serious crisis mode for a year before the Lehman bankruptcy, we cannot say we are out of the woods. And of course it is possible that the Fed has avoided repeating one mistake only to make a new one. A rising gold price is always a disquieting sign.
What, meanwhile, does gold tell us about the stock market? I am not a fan of returning to the gold standard, but it is undeniable that the decision by President Richard Nixon to break that link in 1971 had a profound effect on what followed. If we regard gold as the continuing true measure of monetary stability, it suggests that stock markets’ gains in the almost 50 years since are almost entirely due to “money illusion,” or the erosion of the dollar’s buying power.
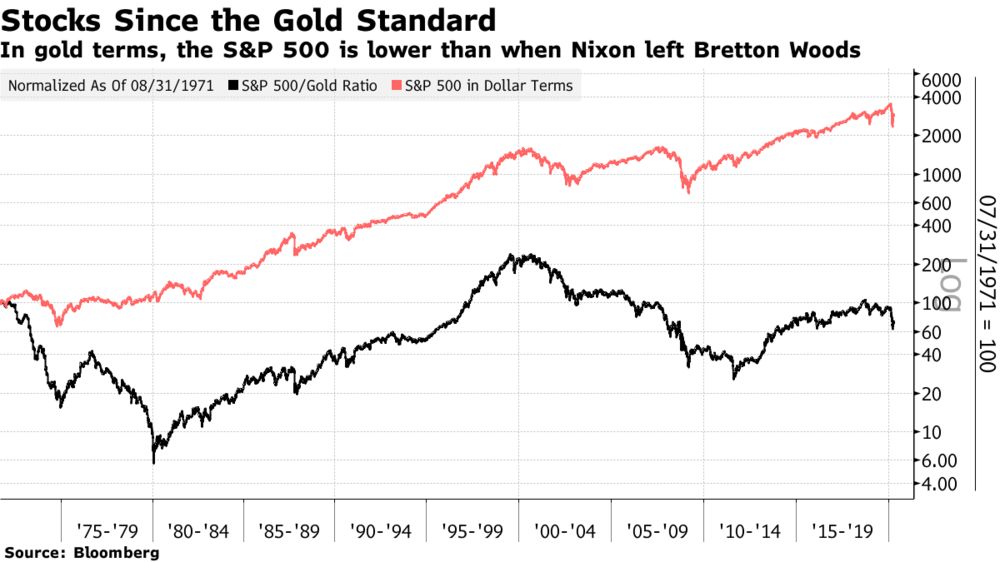
The following chart shows the value of the S&P 500 in dollar terms, and the ratio of the S&P 500 to the gold price, both set to 100 when Nixon left the post-war Bretton Woods agreement:
In gold terms, the stock market was higher than in 1971 for a few years around the top of the dot-com bubble, and again for a few months at the top of the latest bull market. It is now almost 30% below where it was in 1971.
To be clear, stocks would still have been a better investment than gold in 1971, because these numbers don’t include reinvested dividends. But this exercise suggests that stocks’ function as a store of value is largely an artifact of the dollar. The higher gold price also suggests that confidence in the dollar is waning.